Introduction to Unsupervised Learning
Unsupervised learning is a fascinating domain in machine learning that involves drawing inferences from unlabeled datasets. Unlike supervised learning, where the model learns from labeled data, unsupervised learning explores relationships within data without predefined categories. One of the primary methods in unsupervised learning is clustering, which uncovers hidden patterns or groups in the data.
Clustering
Clustering is a technique that groups a set of objects based on their similarity, ensuring that objects within the same group are more similar to each other than to those in other groups. The applications of clustering are diverse, ranging from automatically organizing data and labeling information to understanding the hidden structure of datasets. Examples include news clustering for grouping similar news, customer segmentation, and suggesting social groups.
import numpy as np
import pandas as pd
import matplotlib.pyplot as plt
%matplotlib inline
from sklearn.datasets import make_blobs
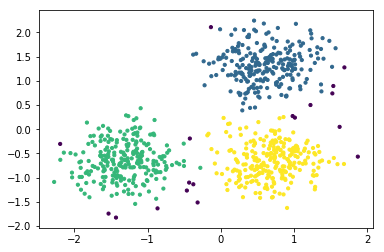
# Generating natural clusters
X, y = make_blobs(n_features=2, n_samples=1000, centers=3, cluster_std=1, random_state=3)
plt.scatter(X[:, 0], X[:, 1], s=5, alpha=.5)
Similarity or Distance Calculation
In clustering, data belonging to the same cluster is considered similar, and different clusters are expected to be dissimilar. Distances or similarities between data points are crucial for clustering. Techniques like Euclidean distance, Manhattan distance, and Cosine similarity are commonly used.
from sklearn.metrics.pairwise import euclidean_distances, cosine_distances, manhattan_distances

X = [[0, 1], [1, 1]]
print("Euclidean Distances:", euclidean_distances(X, X))
print("Cosine Distances:", cosine_distances(X, X))
print("Manhattan Distances:", manhattan_distances(X, X))
Clustering as an Optimization Problem
Clustering can be seen as an optimization problem where the goal is to maximize inter-cluster distances while minimizing intra-cluster distances. This ensures that clusters are well-defined and distinct from each other.
Types of Clustering Methods
There are various clustering methods, broadly categorized into partitioning methods, hierarchical methods, and density-based methods.
Partitioning Clustering
KMeans:
KMeans is a popular partitioning clustering algorithm that aims to minimize the within-cluster sum of squares. It initializes centroids and assigns data points to the nearest centroid, iteratively updating centroids.
from sklearn.cluster import KMeans

kmeans = KMeans(n_clusters=3)
kmeans.fit(X)
plt.scatter(X[:, 0], X[:, 1], s=10, c=kmeans.predict(X))
MeanShift:
MeanShift is another partitioning algorithm that identifies centroids based on the density of data points. It adjusts centroids iteratively until convergence.
from sklearn.cluster import MeanShift

ms = MeanShift()
ms.fit(X)
plt.scatter(X[:, 0], X[:, 1], s=10, c=ms.predict(X))
Hierarchical Clustering
Agglomerative Clustering:
Agglomerative clustering is a hierarchical approach where each data point starts as a cluster and clusters are successively merged based on their similarity.
from sklearn.cluster import AgglomerativeClustering

agc = AgglomerativeClustering(linkage='single')
agc.fit(X)
plt.scatter(X[:, 0], X[:, 1], s=10, c=agc.labels_)
Density-Based Clustering
DBSCAN:
Density-Based Spatial Clustering of Applications with Noise (DBSCAN) identifies clusters based on dense regions in the data space.
from sklearn.cluster import DBSCAN
from sklearn.preprocessing import StandardScaler

X = StandardScaler().fit_transform(X)
db = DBSCAN(eps=0.3, min_samples=10).fit(X)
plt.scatter(X[:, 0], X[:, 1], s=10, c=db.labels_)
Measuring Performance of Clusters
Evaluating the performance of clustering algorithms involves both supervised and unsupervised metrics.
Supervised Metrics
Completeness Score:
Completeness measures whether all data points belonging to the same class are elements of the same cluster.
from sklearn.metrics.cluster import completeness_score

completeness_score(labels_true=[10, 10, 11, 11], labels_pred=[1, 1, 0, 0])
Homogeneity Score:
Homogeneity measures whether all clusters contain only data points that are members of a single class.
from sklearn.metrics.cluster import homogeneity_score

homogeneity_score([0, 0, 1, 1], [1, 1, 0, 0])
Unsupervised Metrics
Silhouette Score:
The Silhouette Coefficient measures the quality of clusters using the mean intra-cluster distance and the mean nearest-cluster distance.
from sklearn.metrics import silhouette_score

silhouette_score(X, labels)
Calinski-Harabaz Score:
The Calinski-Harabaz Score is the ratio between within-cluster dispersion and between-cluster dispersion.
from sklearn.metrics import calinski_harabaz_score

calinski_harabaz_score(X, labels)
Selecting the Right Number of Clusters
Choosing the optimal number of clusters is a critical step. Techniques like Silhouette Analysis and Calinski-Harabaz Score can help in making an informed decision.
# Silhouette Analysis for KMeans
for n_cluster in range_n_clusters:
    clustering(n_cluster, X)

# Calinski-Harabaz Score for KMeans
for n_cluster in range_n_clusters:
    kmeans = KMeans(n_clusters=n_cluster)
    kmeans.fit(X)
    labels = kmeans.predict(X)
    print(n_cluster, calinski_harabaz_score(X, labels))
Conclusion
Cluster analysis is a powerful tool in unsupervised learning, enabling the discovery of hidden patterns and structures within datasets. From partitioning methods like KMeans to hierarchical clustering and density-based clustering, there are diverse approaches to explore. Evaluating the performance of clustering algorithms is crucial, and metrics such as completeness score, homogeneity score, silhouette score, and Calinski-Harabaz score provide valuable insights. Additionally, techniques for selecting the right number of clusters contribute to the effectiveness of clustering algorithms. Whether you’re organizing data, segmenting customers, or exploring social groups, cluster analysis opens up a realm of possibilities in the world of machine learning.
Leave a Reply