Tag: #DataVizCommunity
-

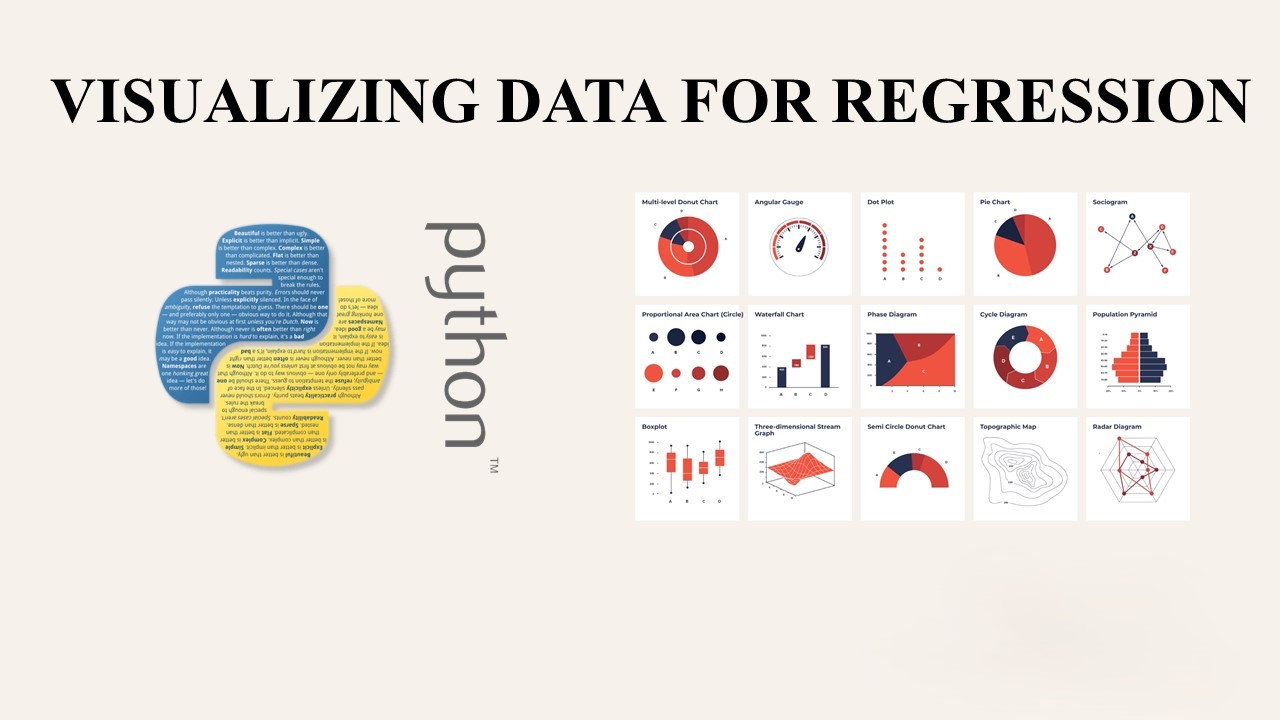
Visualizing Data for Regression
Exploratory Data Analysis (EDA) Exploratory Data Analysis (EDA) is a crucial step in understanding and preparing data for building predictive models. In this lab, we focus on visualizing the dataset related to automobile pricing using Python. The dataset is loaded and cleaned, and now we’ll explore it through various visualizations. Summarizing and Manipulating Data: Developing…
